安装包地址:通过网盘分享的文件:https://pan.baidu.com/s/1iBSiZ4baGzf8KWlhdnDv0w?pwd=9i1u 提取码: 9i1u
代码地址见文章末尾
虚拟机关闭防火墙:
systemctl status firewalld
Prometheus 启动脚本startup-prometheus
1
2
3
4
5
6
7
8
9
10
11
12
13
14
15
16
17
18
19
20
21
# !/bin/bash cd `dirname $0` # 替换为 Prometheus 的实际路径 BASE_DIR=`pwd` echo `pwd` # 定义 Prometheus 的路径 PROMETHEUS_PATH=$BASE_DIR/prometheus # 替换为 Prometheus 的实际路径 PID_FILE=$BASE_DIR/prometheus.pid # 存储进程 ID 的文件 LOG_FILE=$BASE_DIR/logs/prometheus.log # 日志文件 CONFIG_FILE=$BASE_DIR/prometheus.yml # Prometheus 配置文件路径 DATA_DIR=$BASE_DIR/data # Prometheus 数据目录 # 检查是否已经在运行 if [ -f "$PID_FILE" ] && kill -0 $(cat "$PID_FILE") 2>/dev/null; then echo "Prometheus is already running." else echo "Starting Prometheus..." nohup $PROMETHEUS_PATH --config.file=$CONFIG_FILE --storage.tsdb.path=$DATA_DIR > $LOG_FILE 2>&1 & # 后台运行 echo $! > "$PID_FILE" # 将进程 ID 写入文件 echo "Prometheus started with PID $(cat "$PID_FILE")." fi
终止脚本shundown-prometheus
1
2
3
4
5
6
7
8
9
10
11
12
13
14
15
16
17
18
19
20
21
# !/bin/bash cd `dirname $0` # 替换为 Prometheus 的实际路径 BASE_DIR=`pwd` PID_FILE=$BASE_DIR/prometheus.pid # 存储进程 ID 的文件 # 检查 PID 文件是否存在 if [ -f "$PID_FILE" ]; then PID=$(cat "$PID_FILE") if kill -0 "$PID" 2>/dev/null; then echo "Stopping Prometheus..." kill "$PID" rm -f "$PID_FILE" # 删除 PID 文件 echo "Prometheus stopped." else echo "Prometheus is not running." rm -f "$PID_FILE" # 删除 PID 文件 fi else echo "Prometheus is not running." fi
consul 1 2 3 4 5 6 7 8 9 10 11 12 13 14 15 16 17 18 19 20 21 22 23 wget https://releases.hashicorp.com/consul/1.17.2/consul_1.17.2_linux_amd64.zip unzip consul_1.17.2_linux_amd64.zip sudo mv consul /usr/local/bin/consul version consul agent -dev ./consul agent -dev ./consul agent -dev -client 0.0.0.0 -ui
待被发现的java程序的要求 application.yml
1 2 3 4 5 6 7 8 9 10 11 12 13 14 15 16 17 18 19 20 21 22 23 24 25 26 management: endpoints: web: exposure: include: health,info,prometheus metrics: export: prometheus: enabled: true spring: application: name: prometheus-consul-app cloud: consul: discovery: instance-id: ${spring.application.name}-${spring.cloud.client.ip-address}-${server.port} prefer-ip-address: true heartbeat: enabled: true service-name: ${spring.application.name} host: 192.168 .15 .128 port: 8500 server: port: 8111
主程序
1 2 3 4 5 6 7 8 9 10 @EnableDiscoveryClient @SpringBootApplication public class PrometheusMonitoringDemoApplication { public static void main (String[] args) { SpringApplication.run(PrometheusMonitoringDemoApplication.class, args); } }
pom.xml
1 2 3 4 5 6 7 8 9 10 11 12 13 14 15 16 17 18 19 20 21 22 23 24 25 26 27 28 29 30 31 32 33 34 35 36 37 38 39 40 41 42 43 44 45 46 47 48 49 50 51 52 53 54 55 56 57 58 59 60 61 62 63 64 65 66 67 68 <?xml version="1.0" encoding="UTF-8" ?> <project xmlns ="http://maven.apache.org/POM/4.0.0" xmlns:xsi ="http://www.w3.org/2001/XMLSchema-instance" xsi:schemaLocation ="http://maven.apache.org/POM/4.0.0 https://maven.apache.org/xsd/maven-4.0.0.xsd" > <modelVersion > 4.0.0</modelVersion > <parent > <groupId > org.springframework.boot</groupId > <artifactId > spring-boot-starter-parent</artifactId > <version > 2.7.4</version > <relativePath /> </parent > <groupId > org.example</groupId > <artifactId > prometheus-monitoring-demo</artifactId > <version > 0.0.1-SNAPSHOT</version > <name > prometheus-monitoring-demo</name > <description > prometheus-monitoring-demo</description > <properties > <java.version > 1.8</java.version > <micrometer.version > 1.9.5</micrometer.version > <spring-boot.version > 2.7.4</spring-boot.version > <spring-cloud.version > 2021.0.5</spring-cloud.version > </properties > <dependencyManagement > <dependencies > <dependency > <groupId > org.springframework.cloud</groupId > <artifactId > spring-cloud-dependencies</artifactId > <version > ${spring-cloud.version}</version > <type > pom</type > <scope > import</scope > </dependency > </dependencies > </dependencyManagement > <dependencies > <dependency > <groupId > org.springframework.boot</groupId > <artifactId > spring-boot-starter-web</artifactId > </dependency > <dependency > <groupId > org.springframework.boot</groupId > <artifactId > spring-boot-starter-actuator</artifactId > </dependency > <dependency > <groupId > io.micrometer</groupId > <artifactId > micrometer-registry-prometheus</artifactId > <version > ${micrometer.version}</version > </dependency > <dependency > <groupId > org.springframework.cloud</groupId > <artifactId > spring-cloud-starter-consul-discovery</artifactId > </dependency > </dependencies > <build > <plugins > <plugin > <groupId > org.springframework.boot</groupId > <artifactId > spring-boot-maven-plugin</artifactId > </plugin > </plugins > </build > </project >
prometheus配置 prometheus.yml
1 2 3 4 5 6 7 8 9 global: scrape_interval: 5s scrape_configs: - job_name: 'prometheus-consul-app' consul_sd_configs: - server: '192.168.15.128:8500' services: ['prometheus-consul-app' ] metrics_path: '/actuator/prometheus'
consul启动终止脚本 startup-consul.sh
1 2 3 4 5 6 7 8 9 10 11 12 13 14 15 16 17 18 # !/bin/bash cd `dirname $0` # 替换为 consul 的实际路径 BASE_DIR=`pwd` # 定义 Consul 的路径 CONSUL_PATH=$BASE_DIR/consul # 替换为 consul 的实际路径 PID_FILE=$BASE_DIR/consul.pid # 存储进程 ID 的文件 LOG_FILE=$BASE_DIR/logs/consul.log # 日志文件 DATA_FILE=$BASE_DIR/data CONFIG_FILE=$BASE_DIR/consul.hcl # 检查是否已经在运行 if [ -f "$PID_FILE" ] && kill -0 $(cat "$PID_FILE") 2>/dev/null; then echo "Consul is already running." else echo "Starting Consul..." nohup $CONSUL_PATH agent -dev -data-dir=$DATA_FILE -config-file=$CONFIG_FILE -client 0.0.0.0 -ui > $LOG_FILE 2>&1 & # 后台运行,# 此行如若不需要流控熔断功能可把【-config-file=$CONFIG_FILE 】去掉 echo $! > "$PID_FILE" # 将进程 ID 写入文件 echo "Consul started with PID $(cat "$PID_FILE")." fi
shutdown-consul.sh
1 2 3 4 5 6 7 8 9 10 11 12 13 14 15 16 17 18 19 20 21 # !/bin/bash cd `dirname $0` # 替换为 consul 的实际路径 BASE_DIR=`pwd` PID_FILE=$BASE_DIR/consul.pid # 存储进程 ID 的文件 # 检查 PID 文件是否存在 if [ -f "$PID_FILE" ]; then PID=$(cat "$PID_FILE") if kill -0 "$PID" 2>/dev/null; then echo "Stopping Consul..." kill "$PID" rm -f "$PID_FILE" # 删除 PID 文件 echo "Consul stopped." else echo "Consul is not running." rm -f "$PID_FILE" # 删除 PID 文件 fi else echo "Consul is not running." fi
Prometheus黑盒测试 1 2 3 4 5 6 7 wget https://github.com/prometheus/blackbox_exporter/releases/download/v0.23.0/blackbox_exporter-0.23. 0.linux-amd64.tar.gz tar -xvf blackbox_exporter-0.23.0.linux-amd64.tar.gz cd blackbox_exporter-0.23.0.linux-amd64./blackbox_exporter
需要在 Prometheus 的配置文件 prometheus.yml 中添加 Blackbox Exporter 的配置,以监控指定的 IP 和端口。
在 prometheus.yml 中,添加一个新的 scrape_configs 来配置 Prometheus 通过 Blackbox Exporter 进行 TCP 探测:
1 2 3 4 5 6 7 8 9 10 11 - job_name: 'tcp_probes' metrics_path: /probe params: module: [tcp_connect ] static_configs: - targets: ['localhost:9115' ] relabel_configs: - source_labels: [__address__ ] target_label: __param_target
通过请求http://localhost:9115/probe?target=111.229.25.127:6379&module=tcp_connect
会获得
1
2
3
4
5
6
7
8
9
10
11
12
13
14
15
16
17
18
# HELP probe_dns_lookup_time_seconds Returns the time taken for probe dns lookup in seconds # TYPE probe_dns_lookup_time_seconds gauge probe_dns_lookup_time_seconds 1.0149e-05 # HELP probe_duration_seconds Returns how long the probe took to complete in seconds # TYPE probe_duration_seconds gauge probe_duration_seconds 0.029551479 # HELP probe_failed_due_to_regex Indicates if probe failed due to regex # TYPE probe_failed_due_to_regex gauge probe_failed_due_to_regex 0 # HELP probe_ip_addr_hash Specifies the hash of IP address. It's useful to detect if the IP address changes. # TYPE probe_ip_addr_hash gauge probe_ip_addr_hash 3.600422005e+09 # HELP probe_ip_protocol Specifies whether probe ip protocol is IP4 or IP6 # TYPE probe_ip_protocol gauge probe_ip_protocol 4 # HELP probe_success Displays whether or not the probe was a success # TYPE probe_success gauge probe_success 1
成功状态 :probe_success 的值为 1,表明被监控的服务可达且正常运行。
探测时间 :probe_duration_seconds 和 probe_dns_lookup_time_seconds 的值都相对较小,表示响应时间快,这通常是健康服务的标志。
无正则错误 :probe_failed_due_to_regex 的值为 0,表明探测没有因正则表达式问题而失败。
java实现 1 2 3 4 5 6 7 8 9 10 11 12 13 14 15 16 17 18 19 20 21 22 23 24 25 26 27 28 29 30 31 32 33 34 35 36 37 38 39 40 41 42 43 44 45 46 47 48 49 50 51 package com.example.demo.blackboxexporter;import java.io.BufferedReader;import java.io.IOException;import java.io.InputStreamReader;import java.net.HttpURLConnection;import java.net.URL;public class BlackboxProbe { private static final String PROBE_URL_TEMPLATE = "http://172.26.160.119:9115/probe?module=tcp_connect&target=%s" ; public static void main (String[] args) { try { String target = "111.229.25.127:3306" ; String probeUrl = String.format(PROBE_URL_TEMPLATE, target); HttpURLConnection connection = (HttpURLConnection) new URL (probeUrl).openConnection(); connection.setRequestMethod("GET" ); BufferedReader in = new BufferedReader (new InputStreamReader (connection.getInputStream())); String inputLine; StringBuilder response = new StringBuilder (); while ((inputLine = in.readLine()) != null ) { response.append(inputLine).append("\n" ); } in.close(); String[] lines = response.toString().split("\n" ); int probeSuccess = -1 ; double probeDuration = -1 ; for (String line : lines) { if (line.startsWith("probe_success" )) { probeSuccess = Integer.parseInt(line.split(" " )[1 ]); } else if (line.startsWith("probe_duration_seconds" )) { probeDuration = Double.parseDouble(line.split(" " )[1 ]); } } System.out.println("probe_success: " + probeSuccess); System.out.println("probe_duration_seconds: " + probeDuration); } catch (IOException e) { e.printStackTrace(); } } }
blackbox_exporter启动终止脚本 startup-blackbox_exporter.sh
1 2 3 4 5 6 7 8 9 10 11 12 13 14 15 16 17 # !/bin/bash cd `dirname $0`/blackbox_exporter-0.23.0.linux-amd64 BASE_DIR=`pwd` # 定义 blackbox_exporter 的路径 BLACKBOX_EXPORTER_PATH=$BASE_DIR/blackbox_exporter # 替换为 blackbox_exporter 的实际路径 PID_FILE=$BASE_DIR/blackbox_exporter.pid # 存储进程 ID 的文件 # 检查是否已经在运行 if [ -f "$PID_FILE" ] && kill -0 $(cat "$PID_FILE") 2>/dev/null; then echo "blackbox_exporter is already running." else echo "Starting blackbox_exporter..." nohup $BLACKBOX_EXPORTER_PATH > $BASE_DIR/../logs/blackbox_exporter.log 2>&1 & # 后台运行 echo $! > "$PID_FILE" # 将进程 ID 写入文件 echo "blackbox_exporter started with PID $(cat "$PID_FILE")." fi
shutdown-blackbox_exporter.sh
1
2
3
4
5
6
7
8
9
10
11
12
13
14
15
16
17
18
19
20
21
# !/bin/bash cd `dirname $0`/blackbox_exporter-0.23.0.linux-amd64 BASE_DIR=`pwd` PID_FILE=$BASE_DIR/blackbox_exporter.pid # 存储进程 ID 的文件 # 检查 PID 文件是否存在 if [ -f "$PID_FILE" ]; then PID=$(cat "$PID_FILE") if kill -0 "$PID" 2>/dev/null; then echo "Stopping blackbox_exporter..." kill "$PID" rm -f "$PID_FILE" # 删除 PID 文件 echo "blackbox_exporter stopped." else echo "blackbox_exporter is not running." rm -f "$PID_FILE" # 删除 PID 文件 fi else echo "blackbox_exporter is not running." fi
流控和熔断 借鉴sentinel的参数设计 consul配置 启用consul的ACL
修改consul的配置文件consul.hcl
1 2 3 4 5 6 7 8 acl { enabled = true # 启用访问控制列表 default_policy = "deny" # 默认策略为拒绝 enable_token_persistence = true # 启用令牌持久性 tokens { master = "1a2b3c4d-5678-90ab-cdef-1234567890ab" # 主令牌,可由JAVA工具类UUID.randomUUID().toString();生成 } }
重启consul(脚本在上)
执行consul acl list
如果 ACL 系统启用了,你会看到相关的 ACL 配置信息。如果仍然出现错误,说明 ACL 可能没有正确启用,需检查日志或配置文件。
Prometheus配置修改 1 2 3 4 5 6 7 8 9 10 global: scrape_interval: 5s scrape_configs: - job_name: 'prometheus-consul-app' consul_sd_configs: - server: '192.168.15.128:8500' services: ['prometheus-consul-app-demo' ] token: '1a2b3c4d-5678-90ab-cdef-1234567890ab' metrics_path: '/actuator/prometheus'
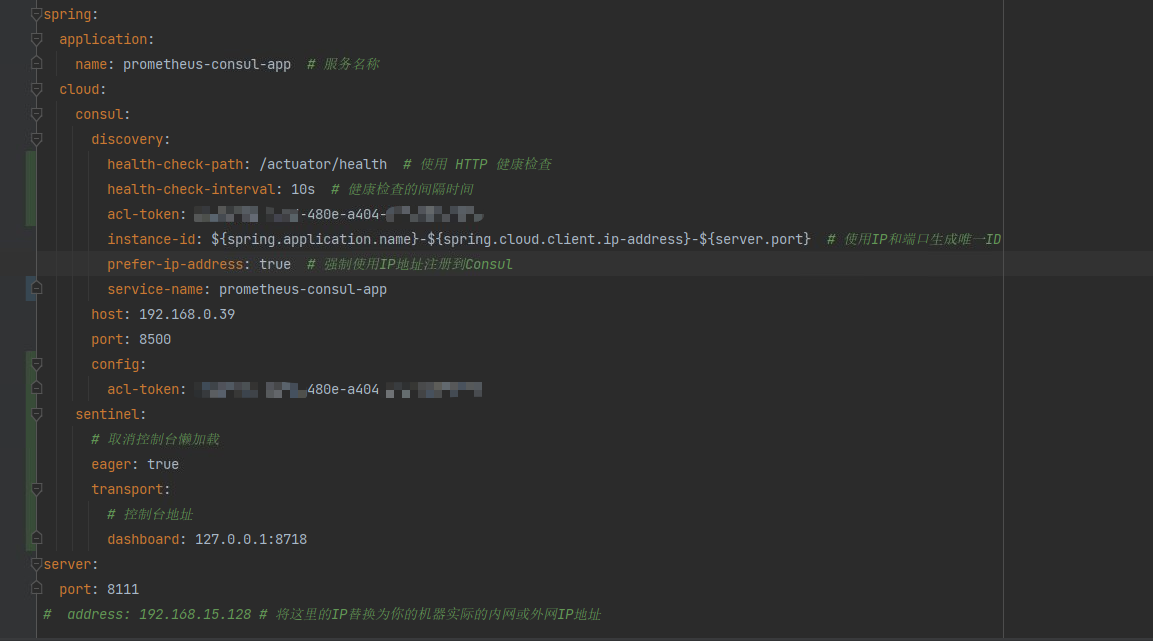
java程序的配置 1 2 3 4 5 6 7 8 9 10 11 12 13 14 15 16 17 18 19 20 21 22 23 24 25 26 27 28 29 30 31 32 33 management: endpoints: web: exposure: include: health,info,prometheus metrics: export: prometheus: enabled: true spring: application: name: prometheus-consul-app cloud: consul: discovery: health-check-path: /actuator/health health-check-interval: 10s acl-token: 1a2b3c4d-5678-90ab-cdef-1234567890ab instance-id: ${spring.application.name}-${spring.cloud.client.ip-address}-${server.port} prefer-ip-address: true service-name: prometheus-consul-app-demo host: 192.168 .15 .128 port: 8500 config: acl-token: 1a2b3c4d-5678-90ab-cdef-1234567890ab sentinel: eager: true transport: dashboard: 127.0 .0 .1 :8718 server: port: 8111
如图
被监控的java程序示例:https://gitee.com/lcdzzz/prometheus-consul-demo
获取监控指标的java程序示例:https://gitee.com/lcdzzz/client